Cosmogenic-nuclide data related to a paper about surface mobility in the Dry Valleys
The point of this page is to assemble data, photos, observations, relevant to a paper on surface mobility and surface erosion processes in the DV. The overall concept is that there are a lot of examples in which the exposure history of loose surface materials is very different from the exposure history of the substrate. This paper should i) go through these examples, and ii) relate them to the other observations of surface sediment transport, i.e. sediment traps, boulder trails, etc. and so on.
Questions on this page: Greg Balco, balcs@bgc.org
This page covers all the observations for bedrock surfaces. However. this page has become too long, so the next section on observations from unconsolidated sediment surfaces continues on another page.
1. Loose clasts on bedrock surfaces.
Basic concept here is that there are a lot of examples where the apparent exposure age of loose clasts is much greater than that of the bedrock substrate they are sitting on. This seems to indicate that the loose clasts are just sitting there as the bedrock surfaces erode beneath them, i.e. we have erosional lag formation.
1.A. Example from Mt. Dewitt.
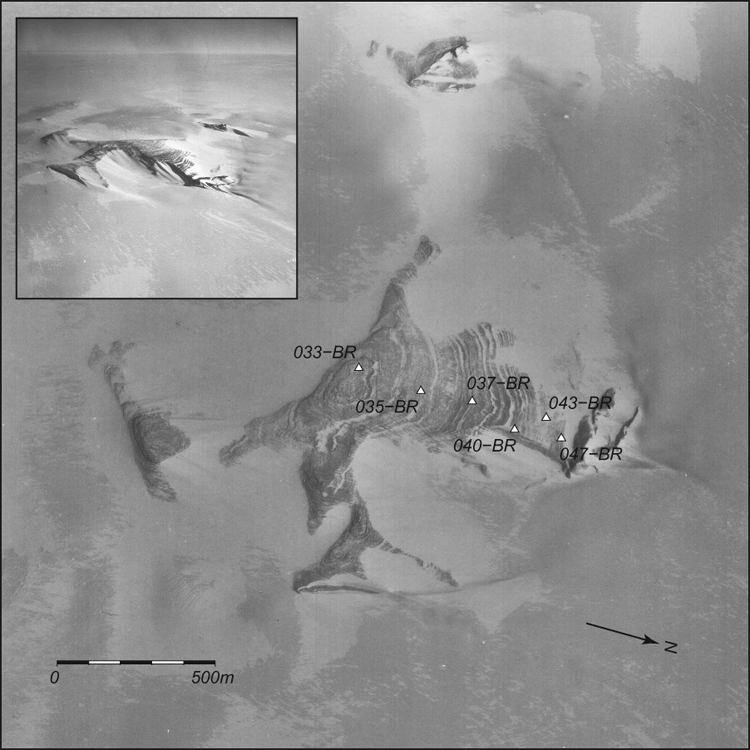
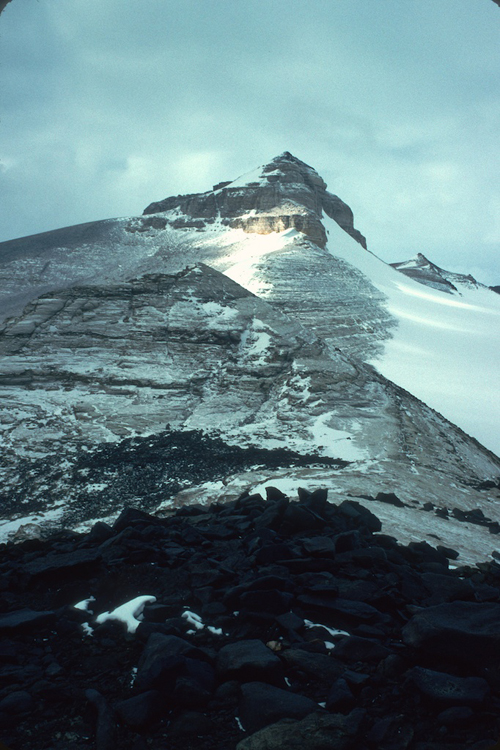
The basic concept here is that Mt. Dewitt is a sandstone pyramid up at the top of the Dry Valleys. The summit is at 2090 m and we collected an elevation transect of bedrock samples between the summit and the lowest exposed rock at the ice margin near our landing site at 1877 m. In the lower half of this elevation range, the sandstone surface is covered with numerous dolerite cobbles. As there is no dolerite outcropping on this peak, they must have been transported by ice and deposited here during ice retreat.
Image above: Oblique (inset) and vertical air photos of Mt. Dewitt. Shows sample sites.
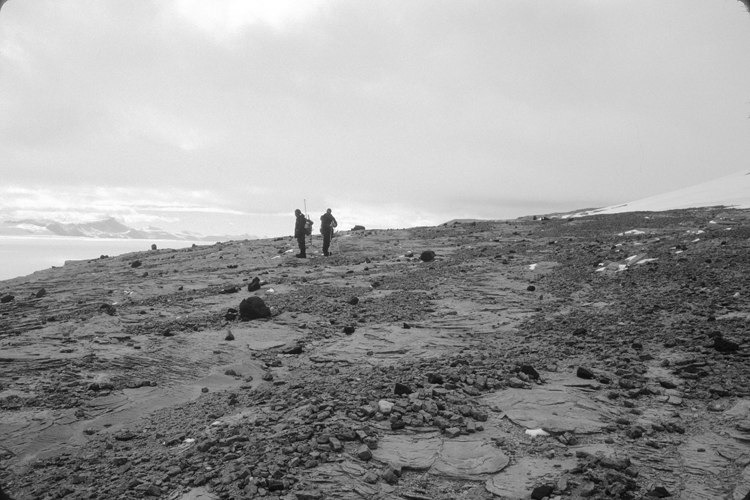
Image above: Putkonen and Morgan at Mt. Dewitt. This is on the middle-elevation slopes near 037-BR. Note many dolerite erratics sitting around on the sandstone surface.
There are a couple of notable field observations here. Mainly, on the air photo above one can see a line just above 037-BR that separates a lighter (above) from darker (below) region. Below this line, there are numerous dolerite erratics present. Above it, there are very few. In fact, we were only able to find two, one of which was directly at the summit. The summit one is sort of a suspicious find, because the summit of Mt. Dewitt was occupied for some time in the early '90's by folks operating a positioning transponder for ice flow measurements around the Taylor Dome borehole. Eric Steig, among others, spent weeks up here. So someone could easily have toted that erratic to the summit. In any case, there is a clear line below which there are lots of erratics and above which there are very few, but not zero.
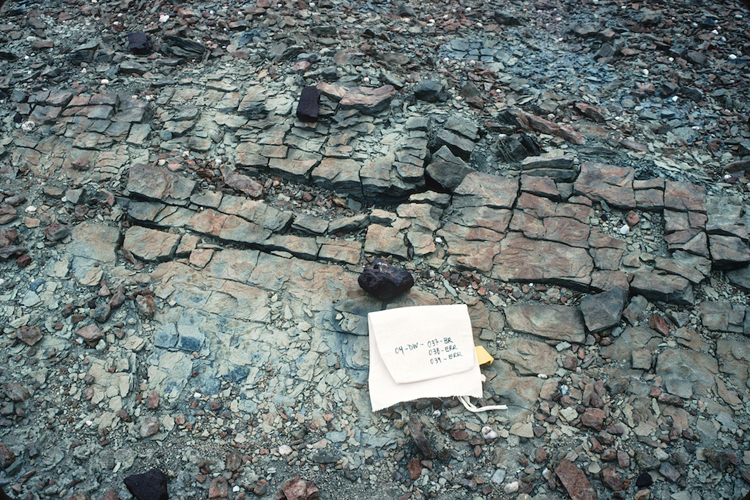
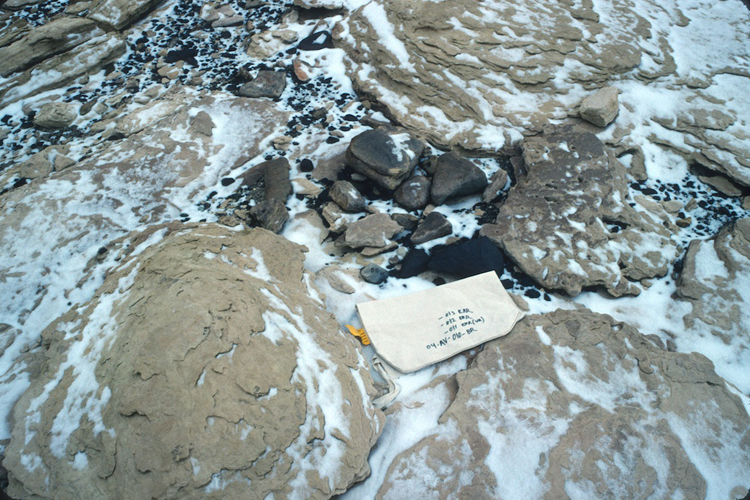
Image above: The dolerite erratic here is sample 038-ERR. The sandstone underneath it is sample 037-BR.
The sample set here consists of six bedrock samples at various elevations and nine dolerite erratics, collected at the same sites. Mostly at the lower sites there are two erratics and one bedrock sample from each site.
I measured cosmogenic He-3 concentrations in pyroxene extracted from all the erratic samples. These results have a few problems as regards precision: mainly there was some difficulty in getting a clean pyroxene separate, so some of the sample was most likely composed of plagioclase, which doesn't retain He. So most likely I am somewhat undersestimating He-3 concentrations in some of these samples. However, as will be clear, this doesn't affect the credibility of what we're using these data for here.
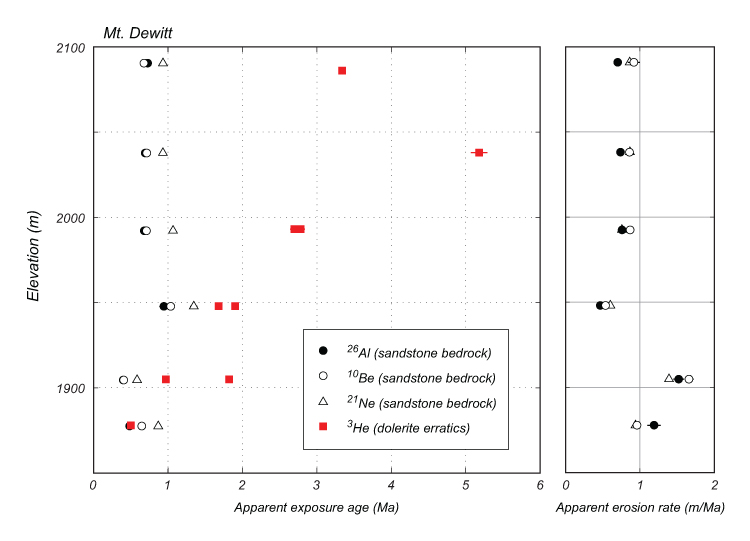
I've also measured Be-10, Al-26, and Ne-21 in all the bedrock samples. The paper on the bedrock transects that I sent to you previously goes into these results in more detail. The main point is that, with the exception of the lowermost sample (which shows evidence of significant ice cover duration), all the 3-nuclide data are most consistent with steady erosion at about 1 m/Myr. This erosion rate is fairly constant at all elevations. This translates into apparent exposure ages of 0.5-1 Myr.
The following plot compares these apparent exposure ages (left plot) on bedrock with the apparent He-3 exposure ages of the dolerite cobbles. The right-hand plot shows the apparent erosion rates for the bedrock samples (as noted above, this is the better interpretation). The point here is that dolerite cobbles at high elevation have exposure ages that are very old relative to the erosion rates implied for the bedrock. It appears that these cobbles have been sitting there for millions of years as the bedrock substrate lowered by several meters.
There is some other stuff here. First, the cobble exposure ages show a pretty clear age-elevation relationship (with the exception of the top sample, which as noted above actually might not really be from the top...I am inclined to disregard this sample entirely). This suggests gradual lowering of the ice surface on average for the last several million years. This is also important because the bedrock-erratic mismatch could theoretically be explained by some very old erratics being delivered from someplace else much more recently than implied by their exposure ages. In this scenario the bedrock surface wouldn't have to have eroded beneath the erratics during the past few Ma. However, this scenario isn't consistent with the observed age-elevation relationship.
If we take the observed age-elevation relationship totally literally, then we have ice surface lowering at 30 m/Myr for 5 Myr. To arm-wave completely, this is sort of in the ballpark for uplift rates due to isostatic rebound caused by glacial trough incision. So maybe the ice sheet is staying at about the same elevation and the peaks are being pushed up through it. Interesting idea. Second, this idea that dolerite cobbles just sit there and tumble occasionally as the rock surface lowers beneath them completely explains observations such as cobbles that are ventifacted on both sides.
1.B. Example from the East Groin.
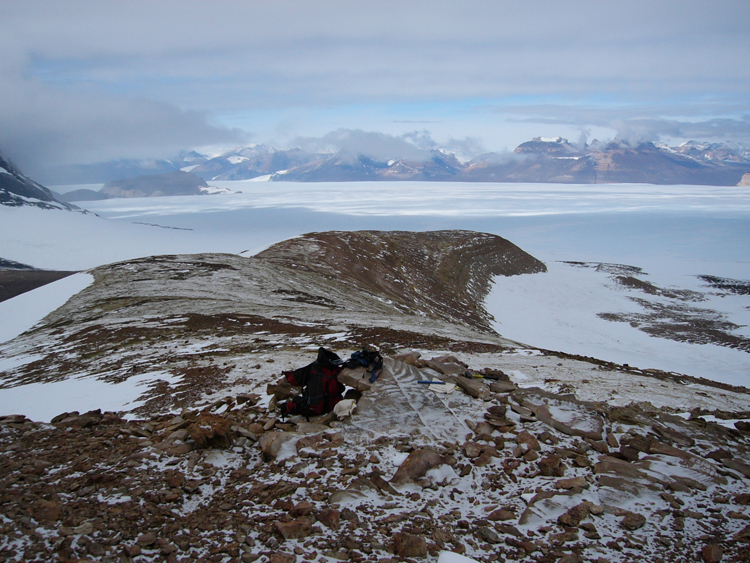
I also collected a transect of bedrock samples from the East Groin, a sandstone buttress adjacent to the Taylor Glacier. The 3-nuclide data for the bedrock samples are in the bedrock-transects paper that I've sent you. The point here is that I also collected and analysed two quartzite surface clasts. These are most likely glacially transported, because there don't seem to be derived from the bedrock here -- however, its hard to say that there's none of this lithology in the Beacon here. First, here is a photo of the East Groin. This is taken from the site of the uppermost sample, looking across Taylor Glacier toward Beacon Valley.
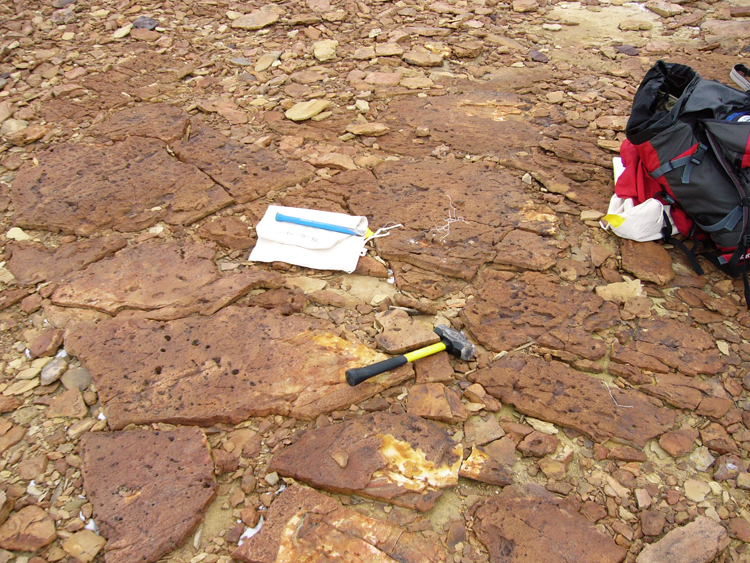
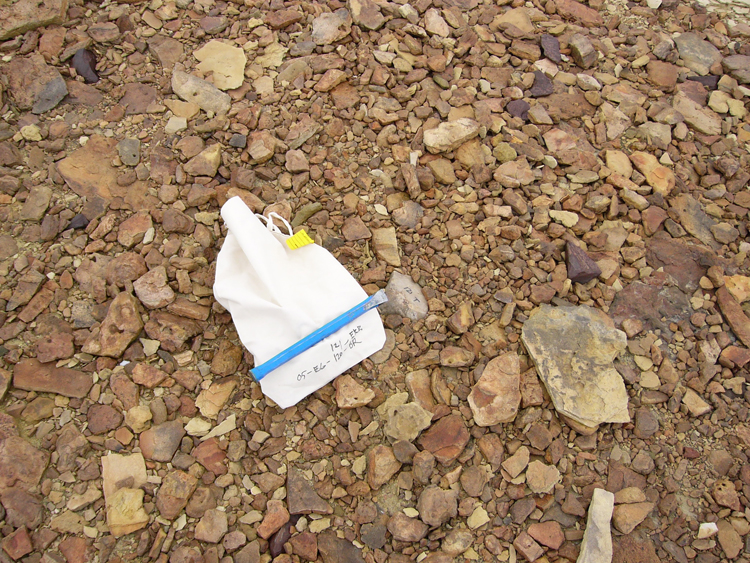
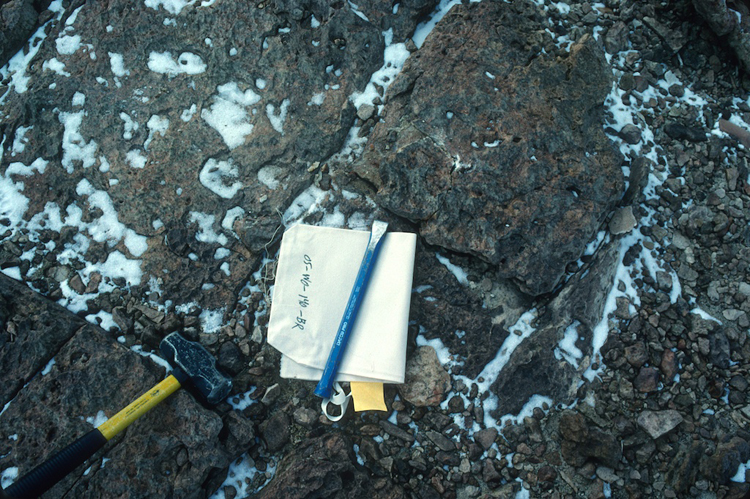
Next, here are photos of the bedrock-clast sample pairs. The first two images show samples 05-EG-120-BR (bedrock surface) and 05-EG-121-ERR (quartzite cobble). Bedrock at this site has Al-Be-Ne concentrations in equilibrium with steady erosion at about 1 m/Myr. Al-Be-Ne concentrations in the clast are at equilibrium with steady erosion an order of magnitude slower -- 10 cm/Myr. This is an exposure age of at least 4-5 Ma, but the nuclide concentrations aren't consistent with steady exposure. The point here is that the clast shows a much longer exposure history than the underlying bedrock. Of course, this is somewhat ambiguous because the clast could have been delivered by ice with a high exposure age already -- unlike the Mt. Dewitt example it's pretty hard to exclude that.
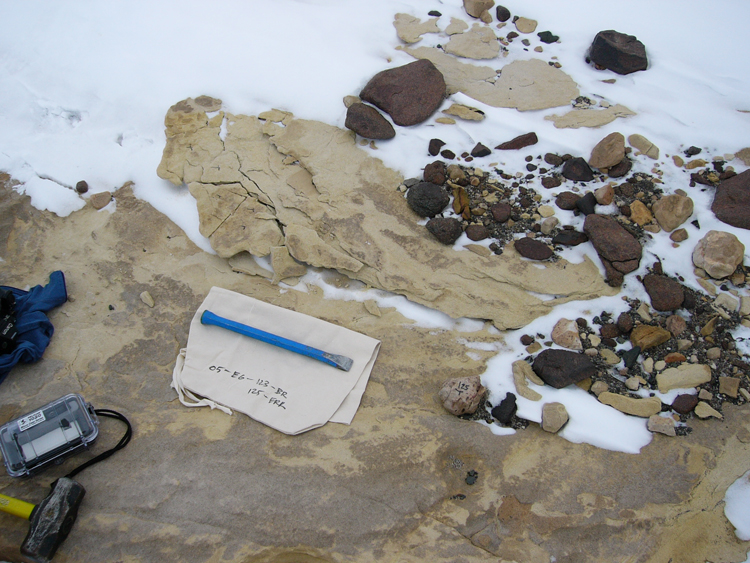
The next image shows both 05-EG-123-BR (bedrock sample, visible above sample bag) and 05-EG-125-ERR (quartzite cobble). These are right next to the present ice margin. Both bedrock and erratic at this site have disequilibrium Al-Be-Ne concentrations consistent with the site being covered by ice about half the time. Again, however, the clast has relatively much higher nuclide concentrations than the bedrock, by an order of magnitude. Again this pair is a bit ambiguous because of the possibility that the clast might have come from someplace else fairly recently.
Here is the same sort of plot as given above for Mt. Dewitt, for the East Groin bedrock and "erratic" clast samples.
Overall summary: it's sort of ambiguous where these clasts come from, but at this site we also observe that loose clasts have much longer exposure histories than underlying bedrock, again consistent with formation of an erosional lag deposit during bedrock degradation at something like 1 m/Myr.
1.C. Examples from Arena Valley
We also have two erratic/bedrock pairs from upper Arena Valley. These are both from sandstone surfaces at the top of the passes defining the top of the west fork of Arena Valley. These sites are weathered sandstone surfaces with a scatter of erratics, as well as loose erratic debris jammed in the cracks. This erratic debris is the Brawhm Till of Marchant, which is supposed to represent a moderate incursion of overflow ice from the Ferrar Glacier over the passes into upper Arena Valley. This till is supposed to be 7.4-11.6 Ma. Then nothing should have happened since then.
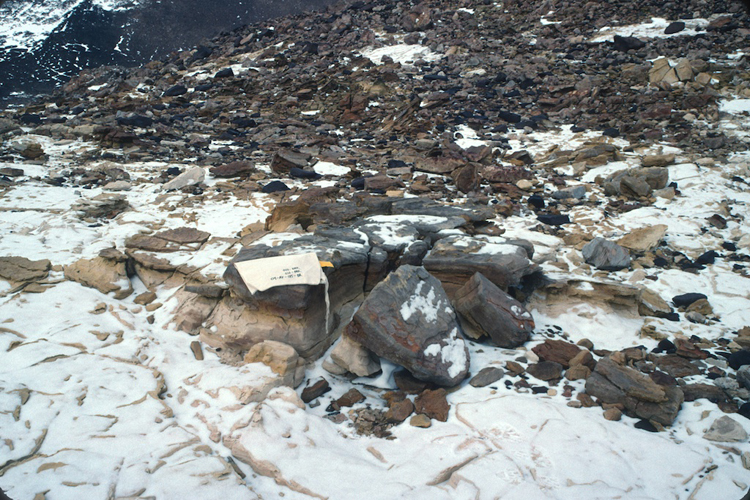
Two photos showing one of these bedrock-erratic pairs -- this is 04-AV-006-BR and 04-AV-007-ERR.
Two photos showing the other -- this is 04-AV-010-BR and 04-AV-012-ERR.
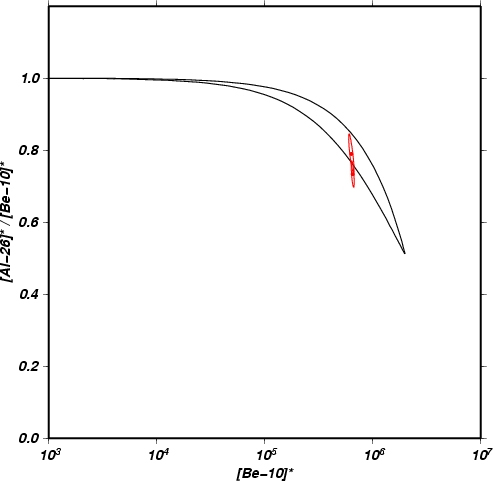
Al-26/Be-10/Ne-21 concentrations in the bedrock samples are all in equilibrium with steady erosion at 0.75 m/Myr. This is the case at both sites -- they agree nearly exactly. Here are these data on the Al-26/Be-10 banana plot. They are clearly on the erosion line.
Thus, the bedrock here is eroding at 0.75 m/Myr. He-3 concentrations in the two dolerite erratics give apparent exposure ages of 1.9 and 1.7 Myr for 007-ERR and 012-ERR respectively, which is equivalent to 0.25 m/Myr erosion. So the results at both sites agree and pretty clearly indicate erosional lag formation with bedrock eroding at 0.75 m/Myr and the cobbles having sat there for at least ~2 Ma. It is perfectly possible that these erosion rates have been true for the entire > 7.4 Ma plus.
I also made He-3 measurements on two other dolerite cobbles from upper Arena Valley where I don't have matching bedrock analyses. These show even slower apparent erosion rates/older apparent exposure ages. This photo shows the site of 04-AV-017-ERR, which is on the plateau at the top of Arena Valley below Altar Mountain, above where we had a GPS station installed. This site is supposed to only have been covered by the Altar till, which is > 11.3 Ma. A dolerite cobble at this site has apparent exposure age of 2.7 Ma and an apparent erosion rate of 0.16 m/Myr.
The last one is 05-AV-103-ERR, which is from the saddle that forms the top of the upper East Fork of Arena Valley. Two pictures follow. This has apparent exposure age 4.3 Ma/apparent erosion rate 0.1 m/Myr. So this is pretty old.
Summary from Arena Valley: at two sites where the geologic evidence indicates undisturbed exposure for > 7.4 Ma, we can quantify the rate of sandstone bedrock erosion and cobble lag formation. At a couple of other sites we don't have any bedrock information, but the dolerite cobbles are really old.
1.D. Examples from the western Olympus Range
We have a similar situation in the western Olympus Range. Here there are a number of sites where it's clear that an erosional lag is forming from more resistant elements of the Beacon sandstone bedrock. We have Al-26/Be-10/Ne-21 measurements on clast-bedrock pairs from three sites.
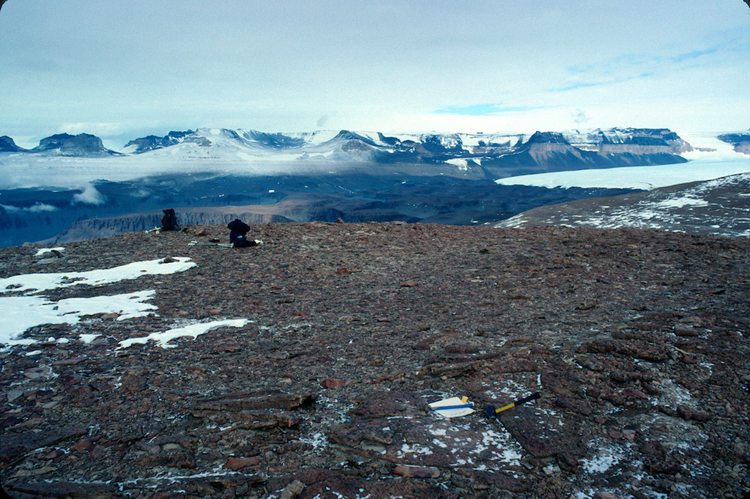
Image below shows the site of 05-WO-132-BR (bedrock sample) and 05-WO-133-FLO (loose surface clast). This is in the middle of the big flat area between Mts. Circe and Dido. At this site it is fairly clear that the surface lag is composed of loose clasts of a resistant bedrock layer that was undercut by erosion of a less resistant layer beneath. The remains of the resistant layer form a lag.
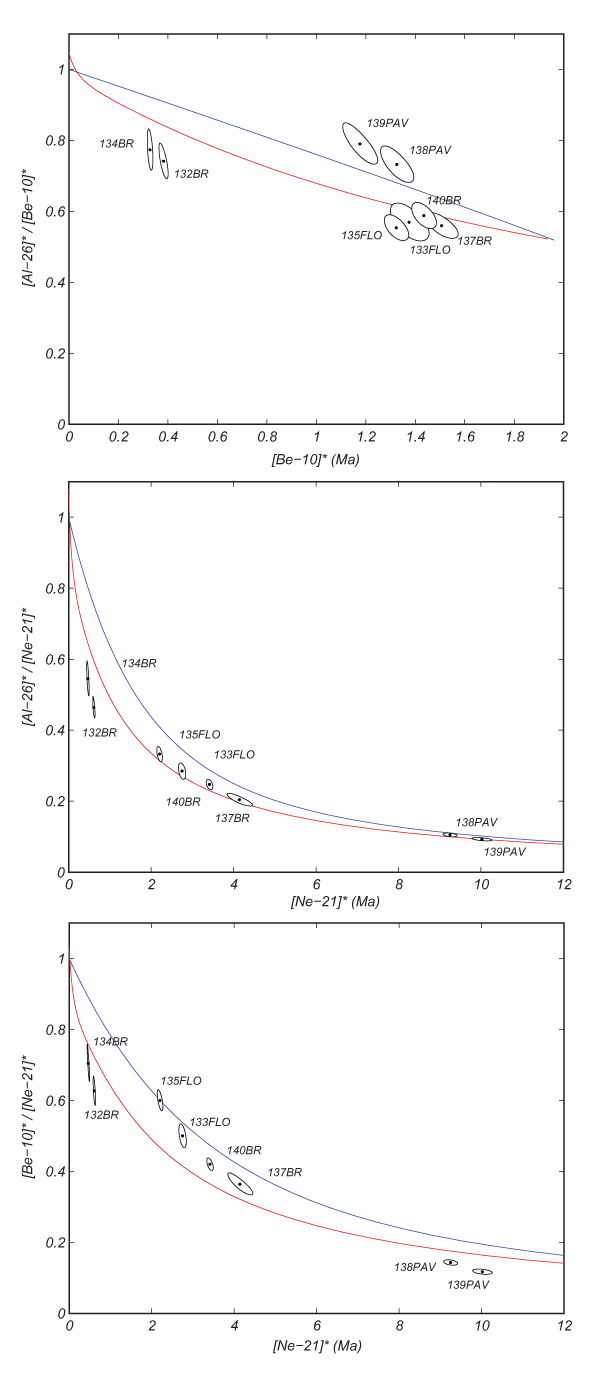
Al-Be-Ne concentrations in the bedrock sample (132-BR, see table and banana diagrams below) are close to equilibrium with ca. 1.7 m/Ma erosion, but are a bit below the steady erosion line, indicating some surface shielding in the past. The surface clast (133-FLO) is also close to but a little below the steady erosion line in Al-Be space, indicating erosion at a much slower rate ca. 0.22 m/Myr. These don't seem to have quite reached the steady erosion line in Be-Ne space, see below, suggesting that they have a finite exposure time and haven't reached production-erosion steady state yet. I haven't calculated what the implied exposure age is.
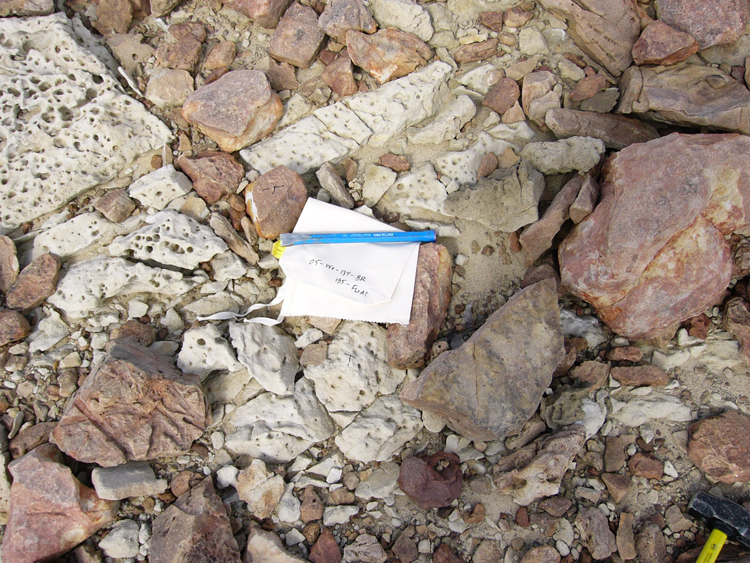
Two images below show the site of 05-WO-134-BR (bedrock) and 05-WO-135-FLO (loose clast). Basically the same situation here -- resistant clasts are sitting on a "popcorn" bedrock surface that is clearly eroding more rapidly than the clasts. This is on the N side of Mt. Circe, on the slope heading N into Victoria Valley.
These two samples give very nearly the same results as the previous pair (see table and banana diagrams below). Both bedrock and clast are close to equilibrium with erosion at about 2 m/Ma and about 0.28 m/Ma, respectively, but the bedrock sample seems to have been shielded a bit. Also the loose clast appears to still have a finite age in Be-Ne space.
Before giving the photo of the last site, here is the table of apparent exposure ages and apparent erosion rates for all three sites in the western Olympus Range.
Apparent exposure age (Myr) Apparent erosion rate (m/Myr) Sample (Al-26) (Be-10) (Ne-21) (Al-26) (Be-10) (Ne-21) 05-WO-132-BR 0.33 +/- 0.01 0.38 +/- 0.01 0.61 +/- 0.02 1.89 +/- 0.09 1.79 +/- 0.07 1.12 +/- 0.04 05-WO-133-FLO 1.48 +/- 0.17 1.94 +/- 0.13 2.74 +/- 0.06 0.22 +/- 0.05 0.22 +/- 0.02 0.25 +/- 0.01 05-WO-134-BR 0.29 +/- 0.02 0.32 +/- 0.01 0.46 +/- 0.02 2.22 +/- 0.13 2.16 +/- 0.06 1.47 +/- 0.07 05-WO-135-FLO 1.29 +/- 0.1 1.81 +/- 0.08 2.2 +/- 0.05 0.28 +/- 0.04 0.25 +/- 0.02 0.31 +/- 0.01 05-WO-137-BR 1.79 +/- 0.16 2.28 +/- 0.12 4.12 +/- 0.21 0.15 +/- 0.03 0.17 +/- 0.02 0.17 +/- 0.01 05-WO-138-PAV 3.1 +/- 0.68 1.82 +/- 0.1 9.2 +/- 0.12 0.04 +/- 0.02 0.24 +/- 0.02 0.07 +/- 0 05-WO-139-PAV 2.47 +/- 0.3 1.51 +/- 0.09 9.96 +/- 0.16 0.07 +/- 0.02 0.32 +/- 0.03 0.07 +/- 0 05-WO-140-BR 1.79 +/- 0.18 2.09 +/- 0.09 3.4 +/- 0.06 0.15 +/- 0.03 0.2 +/- 0.01 0.2 +/- 0 And here are banana diagrams for Al-Be, Al-Ne, and Be-Ne pairs.
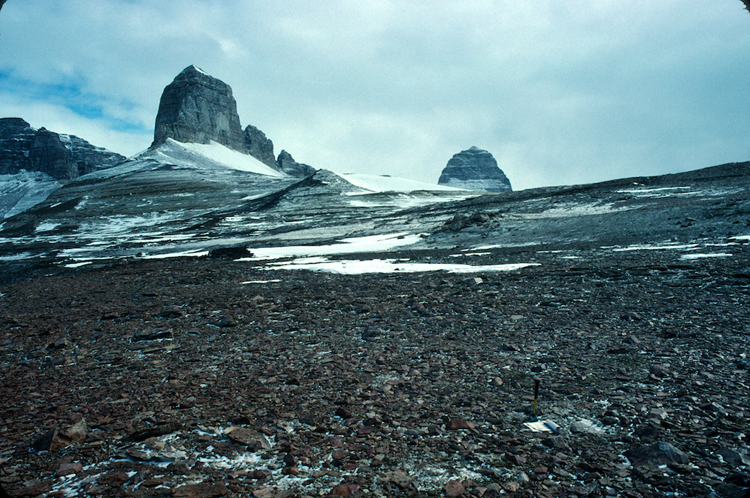
Finally, here are pictures of the last site. Four samples here. This site is on the north rim of Wright Valley to the south of Mt. Dido, so they are basically looking over the edge into the Labyrinth. According to Lewis, Marchant, et al., this site has not been glaciated since 12 Ma.
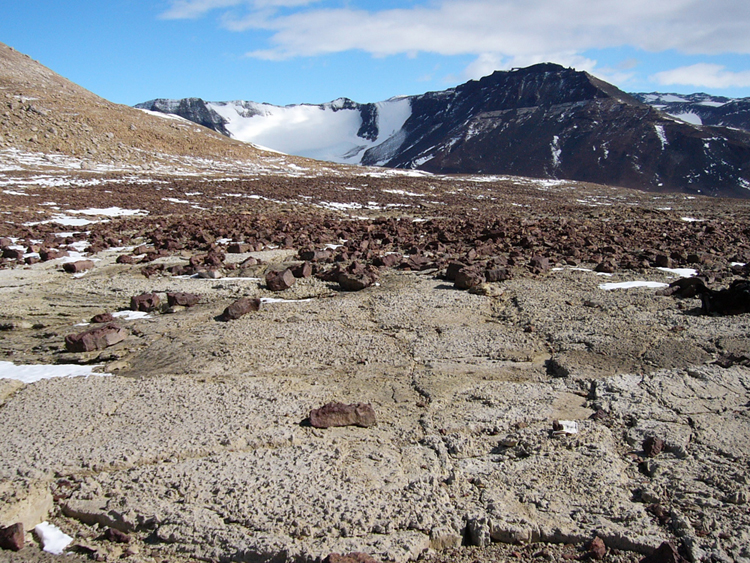
Image below shows overview. This is looking out over the Labyrinth and Wright Upper Glacier.
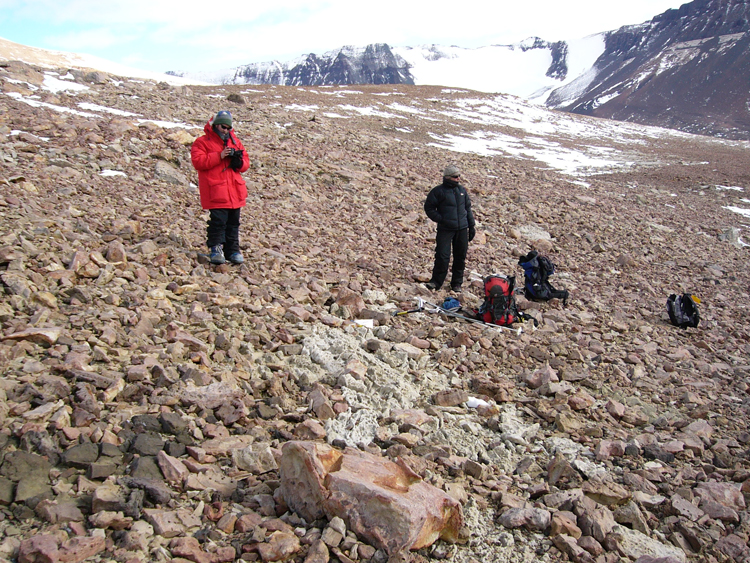
Image below is looking the other direction, up towards Mts. Dido and Circe.
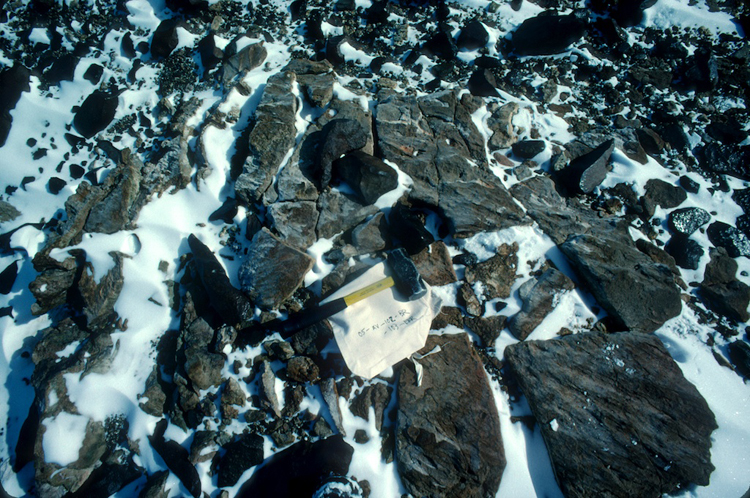
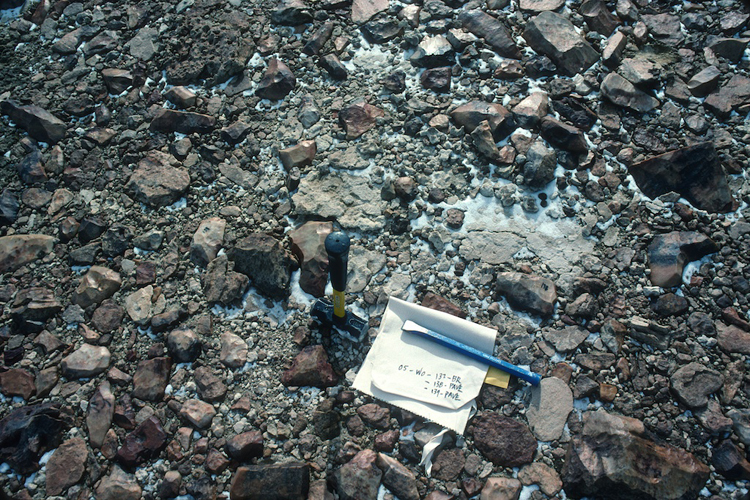
Image below shows site of clast/bedrock sample pair. The bedrock sample is 05-WO-137-BR, and there are two quartzite clasts (numbered, see photo): 05-WO-138-PAV, 05-WO-139-PAV.
Image below shows a second bedrock sample close by. This is 05-WO-140-BR.
The story here is the same, but the numbers are more extreme. 137-BR and 140-BR are close to production-erosion equilibrium for all nuclides at about 0.2 m/Myr. This is a pretty slow erosion rate. The two loose surface clasts, 138-PAV and 139-PAV, have strange nuclide concentrations. The Ne-21 concentrations yield apparent exposure ages of 10 Ma, which may be the oldest apparent exposure ages ever observed in the Dry Valleys. This is damn near the age of a nearby ash dated at 12.4 Ma in the Lewis paper. With the Al-Ne nuclide pair, they are right on the steady erosion line. However, the Be-10 concentrations are wacky -- there doesn't seem to be enough Be-10 in these samples (plot in the forbidden area for Al-Be pair, and below steady erosion for Be-Ne pair). It is hard to get this result from an actual exposure history (there should always be a greater Al-26 deficiency than Be-10 deficiency), so I will have to go back and check that I got all the normalizations and production rates correct at this site.
Summary at western Olympus Range sites: There are a bit more complications with the multiple-nuclide concentrations not matching at these sites, but again it is clear from the very large difference between apparent exposure ages of bedrock and loose clasts that bedrock is eroding beneath the clasts, resulting in the formation of an erosional lag.


2. Unconsolidated sediments showing surface and subsurface materials with incompatible exposure histories.
This page has become too long. This section continues on a new page.